Tag Archives: log

since: Since you last checked

I promised I would get since onto these pages before the end comes, mostly because I don’t remember any other log viewer that has this behavior by default … and I want to be able to remember it in the future.

2015-04-26-6m47421-since

It’s hard for me to be sure though, after so many years and so many log utilities. :\

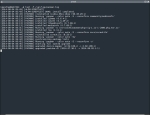
since seems different because, as you might have inferred from the screenshot, it only displays log data since the last time it checked. So you can see the last portions of pacman.log at the top of that image, then the repository update. The next invocation of since only shows the two lines that had been added.

I’m sure other tail-esque tools can do this, and possibly add a few nifty tricks in passing. It’s just a matter of finding the right flags and getting them in order.

For its own part, since keeps its state file in ~/.since, and you have the option to ignore it. You can also tell since to use a special state file, to run periodically, to ignore compressed logs, ignore missing logs, and a lot of other options.

I am not a real bloodhound when it comes to keeping an eye on logs, so at its best, since is useful … but only rarely. On my pseudo-desktop system, there’s almost no call for it.

On a more complex system or in a situation where log files are critical, it might save you some time trying to get the information you need. I’m willing to give it a thumbs-up. 🙂

andatool: Searching forever and ever

I had one more logging tool related to genstats and logintop10 that I wanted to point out, and unfortunately I can’t do much more than this when I show it.

2015-03-03-6m47421-andatool

That’s a disappointment on two counts, first being my relative dunderheaded attempts at feeding andatool a proper regex string. I’m dunderheaded about regex on the whole, so I suppose it’s not to be expected.

The other disappointment is in the fact that andatool is continually skimming through my /var/log/pacman.log file, forever and ever, looking for matching strings. As the log gets updated, the counts update … or they would, if I could get it working and show an animated image.

So you’ll have to use your imagination. Or you could build it yourself, give it a professional-grade regex string and a proper log to look at, and see how it works for you. Never trust me on these things. 😕

I can give you a few pointers though. You have to designate a file for andatool to skim through, with the -i flag, and you have to give it the full path. That might sound obvious, but I wrestled with that for a little bit.

Also, it seems more intuitive to use the -s flag each time, since that tells andatool to start at the beginning of the file and work the whole way through. I can imagine where it might be useful to omit it, but all of my best attempts were more interesting when I included that flag.

And I should mention that you’re not limited to one expression, so you could search through a log for several different instances, and watch each one update.

I don’t recall too many live log filter tools, so andatool seems worthy of mention. Not in AUR or Debian that I could find; don’t let that keep you from trying it though.

genstats: Quick statistical reports

I can see the usefulness of genstats almost immediately. Given a text file, you can pull out a frequency report with very little effort.

2015-02-20-6m47421-genstats

And since genstats handles its input and output in much the same way as cut, you should be able to get the information you want within just a few minutes of compiling it.

It may not be appealing to you to track word frequency in a flat text file, but consider what you could do with genstats and your average log file. That is the author’s suggestion, and the screenshot on the home page gives a good example of some advanced genstats usage.

My only complaint about genstats is so trivial that I’m embarrassed to mention it. In a file with 12 lines, and with four of the words in the second field being the same, the display should read “33%,” not “0.33%.” The latter is a third of a percent, while the former is a third of the whole. Or perhaps there is another calculation at work there, that I’m not sure about.

I get the picture though. And having said that, I suppose it’s worth mentioning that gentstats doesn’t give you a lot of control over the output. As best I can tell, that is the only style of report you’ll see from genstats.

genstats appears to be a free-roaming program; it’s not in Arch/AUR or Debian. So if you want something quick and easy to package, this might be one. 😉

logtop: Kind of like a *top … for a logs

I’m not a log nut. I mean, I don’t spend hours poring over logs to try and find the source of my angst (I’m not a terribly angsty person though).

I do know that’s a favorite hobby for some people and professions, and to that end, logtop may be exciting.

2014-12-24-jsgqk71-logtop

logtop is kind of like a *top, if it makes sense to watch a log continually for updates and changes. And as the author suggests, using logtop in this sense

tail -f /var/log/pacman.log | ./logtop

is much the same as doing this

watch 'tail /var/log/pacman.log | sort | uniq -c | sort -gr'

Bt you could say that equating logtop to that line means it’s not adding much to the classic black-and-white Unixy tools you probably already have.

And given that tail already has an -F flag for following log updates, it might not seem like logtop is actually an improvement.

My example doesn’t do much justice to logtop though, since it is prepared to handle much heavier and more dense log updates, as might happen with machines more powerful and active than my puny Pentium 4.

And given that logtop is prepared to calculate and show line rate stats and contort its output to follow specific formats, I’d be doing a great disservice to logtop by dismissing it out of hand.

But I’m not the best judge of these things, since I already confessed that watching logs was something I do rarely at best. Those of you who find solace or salary in staring at logs … you are the target demographic here. 😉

yfklog: A text-only ham radio log

My daily adventure with ls vimwiki/ | shuf -n1 has dropped me off in the deep end again, this time with a lovely little application that I know ab-so-lutely nothing about.

2014-10-04-6m47421-yfklog-01 2014-10-04-6m47421-yfklog-02

That is yfklog, which is a ham radio log that … I just don’t have any frame of reference for. I know so little about ham radios, I’m embarrassed to say anything about it at all for fear of embarrassing myself on a worldwide scale.

On the other hand, today is Sunday, so it’s unlikely that anyone would travel across this page and see my blunder. … 😕

I can tell you that it has a nice color scheme that is easy to read. I can tell you it has a menu-driven layout and is very easy to navigate.

And I can tell you the one shortcoming that I could see, that it didn’t resize cleanly to terminal dimensions other than the specific size you see above.

Now I am afraid I have to end this, because until I learn something about ham radios, and then learn how a logging tool would be useful, and then learn how to use yfklog … well, I’m wasting your time. 😦

head and tail: Flip a coin

I should have mentioned one or both of these by this point in time. I use both head and tail on an almost-daily basis, and leaving those two out until now was an egregious oversight. 😳

Both head and tail are easy enough to figure out: By default, they show the first and last 10 lines of a file, respectively. Nothing fancy there.

2014-08-04-6m47421-head-tail

There are a few flags that are worth mentioning, and since both head and tail are owned by coreutils, some of those options are shared between the two.

  • -cN: Shows N characters (technically bytes) instead of lines. This can be a godsend if you just want to pluck a certain number of characters out of /dev/urandom.
  • -n: Sets the number of lines to show, so you’re not limited to just 10. You can use bytes here as well, and specify a specific data quantity with conventional suffixes for multipliers. So for example, head --bytes=1b sample.txt would show the first 512 bytes of sample.txt.
  • If you add a minus sign to the --bytes data quantity in head, or a plus sign to the --bytes data quantity in tail, both tools will omit the last or first block of that size. That might be a little confusing; think of head --bytes=-12 sample.txt as “show me all but the last 12 characters of sample.txt” and tail --bytes=+12 sample.txt as “show me all but the first 12 characters of sample.txt.” It might take a little getting used to, but it works, and can be handy.

tail has another flag that deserves attention, mostly because I get the feeling most people don’t know about it. We’ve looked over a lot of log display utilities in the past, and most of them operate by hovering over a log file and echoing it to the screen when it changes. If you pick the right tool, it might also colorize the text. 🙂

Perhaps you knew this and perhaps you didn’t, but tail has a built-in log display mode, as the --follow flag.

2014-08-04-6m47421-tail-follow

As you can see there, with no more than just the -F option, you’ll get a by-the-second update of what appears in a log file, each line added to your display as it is added to the original file. No muss, no fuss.

Like I said, you get both of these tools as part of coreutils, and I have yet to meet a distro that didn’t include that by default. So they’re probably on your machine, and I hope you make good use of them. 😉

colorex: I might as well include them all

This randomized revisitation of the C section has been a veritable tapdance through colorization tools. If I had known I had so many, I would have devoted a whole week to them.

I have one more that starts with C, and then I’ll return to the entire alphabet, as determined by shuf and ls. And since I’m on a roll with colorizing tools, I might as well finish up with colorex.

2014-08-01-lv-c5551-colorex

A lot of the “shortcomings” I mentioned in clog are resolved in colorex. For example, it will, as you can see, colorize specific chunks or strings of letters, for as many times as they appear on a line. It can also bounce between colors even when they are exactly adjacent.

And most of colorex’s syntax is at the command line, so you can declare a color as you build the filter command. It also adds a blink code, underlining effects and bolding … only some of which is visible in a virtual console, but you get the idea.

clog had a very straightforward configuration style, but colorex will require you to be a little more adept at the command line. Expect to escape some of your more complex searches and/or regexes to make sure colorex understands what you want.

As an added touch, colorex has a randomization command, which will either surprise you with its results or drive you batty with the spattered color effects.

2014-08-01-lv-c5551-colorex-random

Not since toilet has there been such a commanding use of color on my lowly X41. …

I should mention that the random effects only seem to work on a full line. And out of fairness, I should mention that colorex doesn’t have the same degree of control over color — like red on purple text — that you can get quite easily with clog. Perhaps that will be in future versions.

In spite of those shortcomings, I’m more inclined to adopt colorex than clog, just because it feels like there’s a stronger sense of control with the former than with the latter. It may not offer the same range of controls and it might be a little more challenging to configure, but it definitely picks up what clog stepped over.

clog: Custom color for logs

I seem to be awash of colorizing programs as I chip away at the C section. This is clog, which the home page describes as a colorized log tail utility.

2014-08-01-lv-c5551-clog

That’s mostly true. It does colorize text and it does apply more to logs than straight text files. It lacks a feature or two that would make it a peer of tail.

Mostly, it lacks the ability to strain out the last lines of a log. By default, clog dumps everything to STDOUT, and ignores flags like -10 that are native to tail. A bit of a misnomer, then.

You have two options in your .clogrc file: either highlight an entire line, or highlight matching sequences of letters. (You can also suppress lines, which might be useful.) In that way you could use clog as a kind of stylized grep, and add a few more color options.

Some shortcomings: When you highlight a string of letters or a word, you will only see highlighting on the first occurrence. As far as I could tell, there was no way to highlight the same sequence multiple times in the same line. Several different colors on the same line will work, but only the first match for each color.

Furthermore, if you ask for full-line highlighting and the line matches more than one filter, you’ll only see one highlighting. I couldn’t make clog split highlighting. You can, however, highlight letter sequences overtop of line highlighting.

Those are shortcomings, but only if you’re trying to make clog behave like a strict color filter, and not a log colorizer. Think of clog like ccze, not like colout (or highlighter or pygments).

On the plus side, clog’s syntax for screening colors is terrifically simple. Step through the first three or four examples and you’ll have multicolor log displays in no time. And clog supplies date and time functions in case you want to stamp the output with either of those.

clog is a good tool, but not one I plan on adopting. I rarely peek at my logs anyway, and clog doesn’t handle enough grep-like colorizing to take over that role. If its abilities expand, I might consider it.

wtime: The laconic task tracker

Another console timekeeper for the W section: wtime. And this one is particularly closemouthed.

2014-06-30-6m47421-wtime

wtime has about six possible options: Start, stop, target a particular task (otherwise it uses “default”), show how many seconds have elapsed since the start, and sum the time spent on the task between a start and finish date.

Aside from that, wtime has very little to say for itself.

Now I know, that as a resourceful and enterprising young Linux devotee, you see a lot more potential in wtime than just something that spits out seconds since a start marker.

And I know you’ve already come up with a solution for translating wtime’s rather clunky output to a clean hours-minutes-seconds display.

No? You haven’t? You mean you want to see my suggestion? Okay, here’s one I’m borrowing, with a tiny adjustment, from Jaidu Saikia.

kmandla@6m47421: ~/downloads/wtime$ echo - | awk -v "S=$(./wtime -c)" '{printf "%d:%d:%d",S/(60*60),S%(60*60)/60,S%60}'
0:10:11

awk to the rescue, it seems. 😉

If you hadn’t gleaned the info from the screenshot or the help pages, you can manage more than one task at a time. It does require you to prefix every command with the -t flag though, otherwise you’ll fall back to “default.” I see how and why this happens, but I’m sure there are better ways to handle it.

wtime is not in Arch/AUR or Debian. It’s a free-roaming program!

wtime doesn’t talk much, it’s a little cumbersome for multiple tasks and the output it gives is somewhat rudimentary. I don’t deny it works, but it has that exceptionally sparse feel, like a homework project or a tiny tool just for the author’s purposes.

With a little creativity you can get it going in a usable state, but with so many other options for time trackers and work logs, I have a feeling wtime will be quickly eclipsed. :\

worklog: Work on, work done, work sum, work today

Time-tracking software again, and this time it’s one that has been around for a while.

2014-06-29-6m47421-worklog

My first run-in with worklog was about four years ago, and it seems quite different now. Could it be that the project has changed hands, or the name has been juggled between authors?

I don’t know. I should mention though, that the web site I linked to four years ago has gone dead. Nothing to be read into that; it happens sometimes.

But worklog looks a bit different too. The screenshot I snapped way back then doesn’t look much like what I have on my screen now. I should mention that some of the options listed in the help pages trigger python errors.

Usually I would blame that on differences between python versions (those always seem to crop up among unmaintained software, whenever python gets a dot-bump) but this time it only makes me suspicious. (The python errors cropped up at work on --all for me, which I took to mean there would be some sort of interactive mode. That might be where that other screenshot came from. I honestly don’t remember. 😦 )

worklog abbreviates itself to just work when installed, and it’s a simple matter of triggering a timer with work on Project to start, and work done when you’re … done. 🙄

Aside from that, you can ask for a breakdown of the work you’ve done today with work today and get a total sum of time spent with … you guessed it: work sum. There are a few other options for switching projects and editing descriptions, but if you can handle those four, you’ll do fine with worklog.

worklog is a decent choice if your time-tracking needs are simple, and neither timebook, timetrap nor punch is of interest. And if none of these is worthy of your attention, then may I suggest … ?